I am managing a mesh with about 35 nodes served by 8 router_client GW’s connected together vi a MQTT server. All the devices are set MEDIUM_FAST what happens is that while monitoring my GW (mioGW) my Ptython PyQT5 application I frequently detect my AirUtilTX reaching 10% while all other GW’s in the mesh do not show but seldom this value. The device is a Tlora2-1.1.6 and firmware is 2.1.0
I noticed also that all the occurences of AirUtilTX above/at 10% induce an autoreboot emitting a new ADMIN_APP shortly after and the AirUtilTX restarts from 0. Was this behavior specifically designed or is it due to a bug?

Is your node in the middle of the mesh (or at least in reach of more nodes than the others), using more frequent Telemetry/NodeInfo updates or using a higher hop limit than the others? That might explain it hitting 10% airtime utilization more frequently.
Doing a reboot is not designed and might be a bug. It would be useful if you could catch the logs when this happens.
OK, I’ll try to get a more detailed log in case I watch a reboot. I was not watching the router_client device but I assumed it did a reboot because the ADMIN_APP message is always sent after boot and the eventual telemetry message always shows a AirUtilTX value close to 0. Maybe the ADMIN_APP is sent under other circumstances but just boot but I am not aware of those.
11/03/23 Probably I should have to amend my initial statement since this morning I came across with another unexpected ADMIN_APP from my router_client when the AirUtilTX value was 8.7%. Actually I didn’t see any rebooting but the ADMIN_APP message and the device’s telemetry restarting from 0,x. So the question is: in what circumstance the device is sending a ADMIN_APP message? (The first ADMIN message was at 08:21 as I started my application) Could it be an unsolicited reset to cause the ADMIN msg?

Reboot, shutdown, factory reset, node db reset, device metrics and config are all sent over the admin app. iOS uses admin messages for everything.
Ok, but no config parameter was changed no shutdown was issued or other changes set intentionally so I want to understand where the triggering of ADMIN_APP comes from. I’ll set up a debug log monitor to find out the reason.
Looks to be your Bluetooth connected radio
You can see all the admin messages here protobufs/admin.proto at master · meshtastic/protobufs · GitHub what client apps are being used?
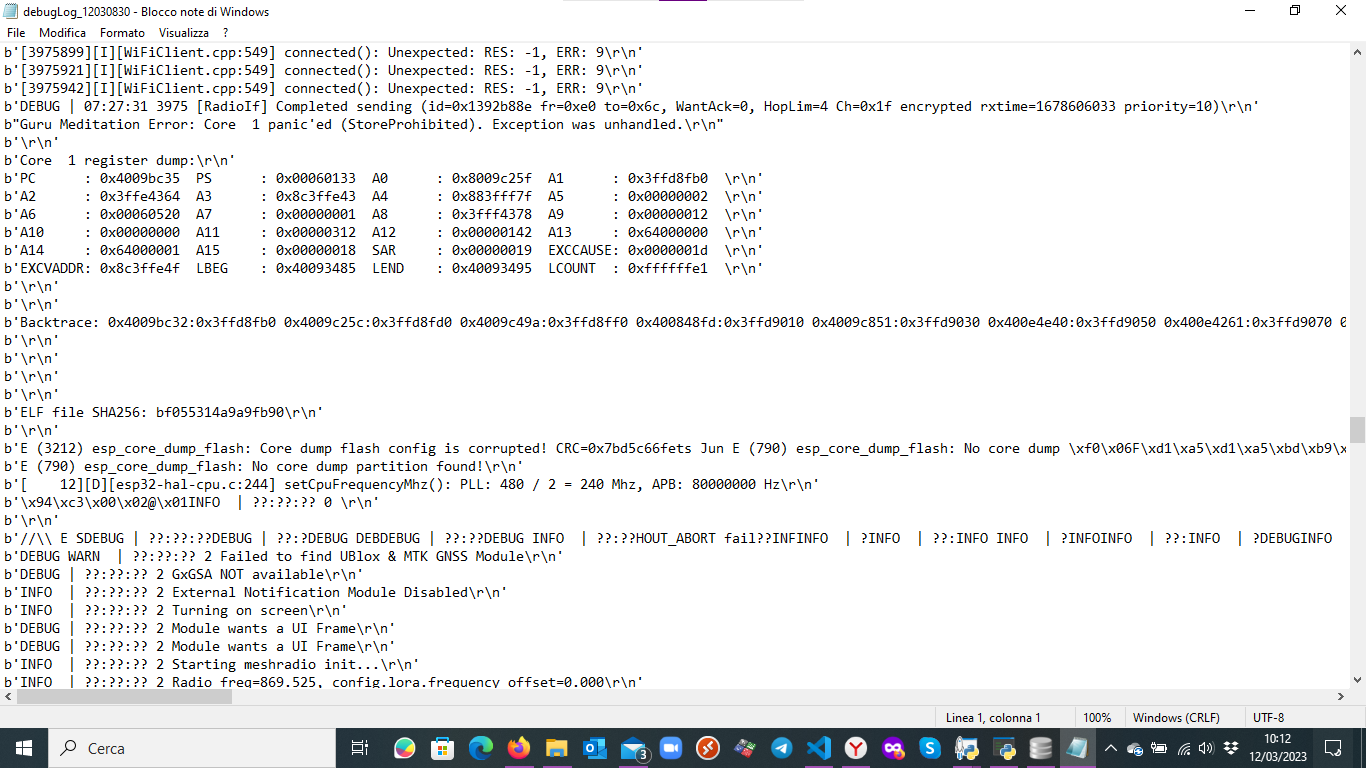
In the meantime I picked up a debug log where actually I see a sort of reboot caused by an error. I attach a image of the log here.

Can you paste the full backtrace here? That gives more info on where it went wrong.
You can also decode that as explained here: Stacktraces | Meshtastic
Backtrace: 0x4009bc32:0x3ffd8fb0 0x4009c25c:0x3ffd8fd0 0x4009c49a:0x3ffd8ff0 0x400848fd:0x3ffd9010 0x4009c851:0x3ffd9030 0x400e4e40:0x3ffd9050 0x400e4261:0x3ffd9070 0x400e4272:0x3ffd9090 0x400e44aa:0x3ffd90b0 0x400e455c:0x3ffd90d0 0x4020eff2:0x3ffd90f0 0x400d5aa5:0x3ffd9110 0x400d5b5a:0x3ffd9130 0x400fc2e5:0x3ffd9150 0x400deb8a:0x3ffd9180 0x4012e6f9:0x3ffd91a0
Here is what I found in the log
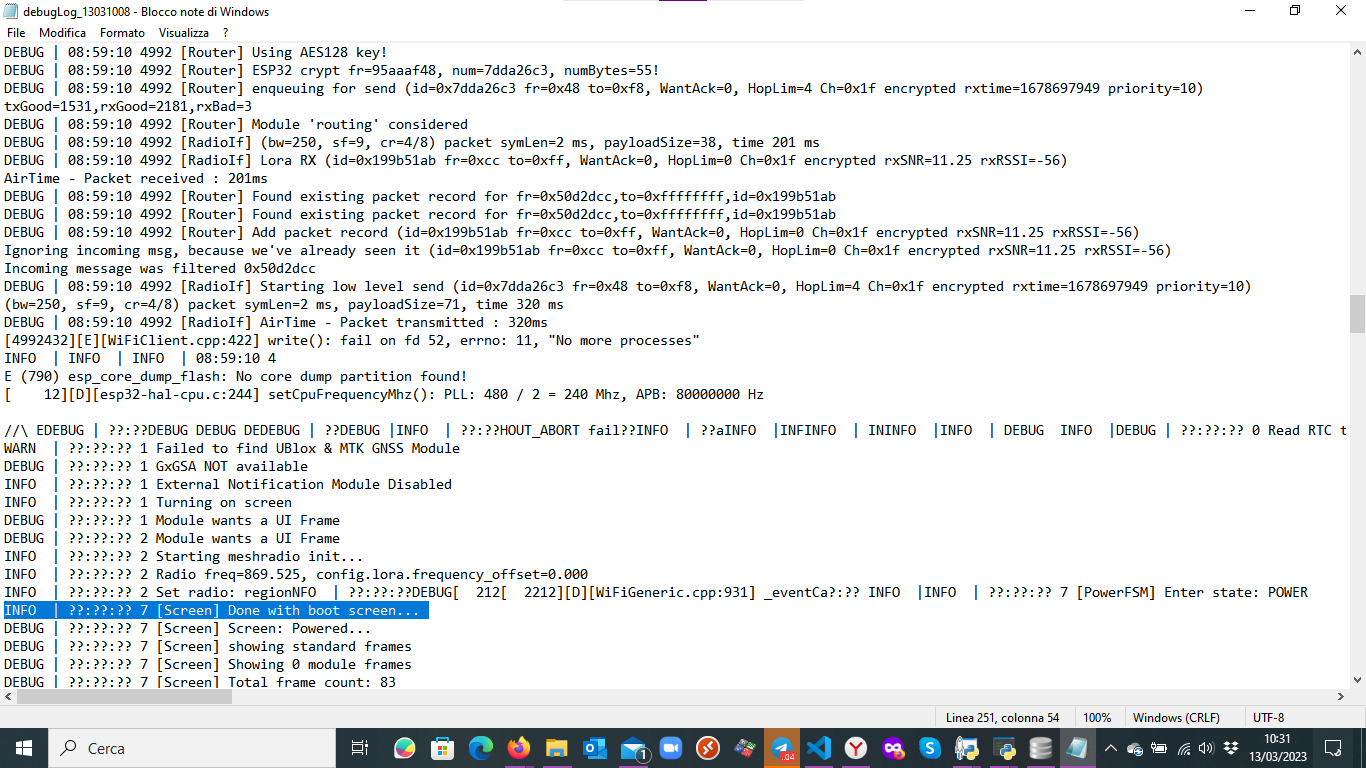
Thanks for the reference. This morning I had another occurrence of unsolicited reboot not due to heap issue. Here is the snapshot where I see a reboot without any explicit reason. In any case these reboots are not correlated to the airUtilTX in excess of 10% since in this case it was at 6%.
Decoded stack trace is as follows:
0x4009bc32: remove_free_block at /Users/ficeto/Desktop/ESP32/ESP32S2/esp-idf-public/components/heap/heap_tlsf.c:646
  \-> inlined by: block_remove at /Users/ficeto/Desktop/ESP32/ESP32S2/esp-idf-public/components/heap/heap_tlsf.c:261
  \-> inlined by: block_merge_prev at /Users/ficeto/Desktop/ESP32/ESP32S2/esp-idf-public/components/heap/heap_tlsf.c:351
  \-> inlined by: tlsf_free at /Users/ficeto/Desktop/ESP32/ESP32S2/esp-idf-public/components/heap/heap_tlsf.c:896
0x4009c25c: multi_heap_free_impl at /Users/ficeto/Desktop/ESP32/ESP32S2/esp-idf-public/components/heap/multi_heap.c:363
0x4009c49a: multi_heap_free at /Users/ficeto/Desktop/ESP32/ESP32S2/esp-idf-public/components/heap/multi_heap_poisoning.c:334
0x400848fd: heap_caps_free at /Users/ficeto/Desktop/ESP32/ESP32S2/esp-idf-public/components/heap/heap_caps.c:512 (discriminator 2)
0x4009c851: free at /Users/ficeto/Desktop/ESP32/ESP32S2/esp-idf-public/components/newlib/heap.c:39
0x400e4e40: MemoryDynamic<_meshtastic_MeshPacket>::release(_meshtastic_MeshPacket*) at /home/runner/work/firmware/firmware/src/mesh/Router.cpp:186
0x400e4261: RadioLibInterface::completeSending() at /home/runner/work/firmware/firmware/src/mesh/RadioLibInterface.cpp:305
0x400e4272: RadioLibInterface::handleTransmitInterrupt() at /home/runner/work/firmware/firmware/src/mesh/RadioLibInterface.cpp:290
0x400e44aa: RadioLibInterface::onNotify(unsigned int) at /home/runner/work/firmware/firmware/src/mesh/RadioLibInterface.cpp:199
0x400e455c: non-virtual thunk to RadioLibInterface::onNotify(unsigned int) at ??:?
0x4020eff2: concurrency::NotifiedWorkerThread::checkNotification() at /home/runner/work/firmware/firmware/src/concurrency/NotifiedWorkerThread.cpp:79
0x400d5aa5: concurrency::NotifiedWorkerThread::runOnce() at /home/runner/work/firmware/firmware/src/concurrency/NotifiedWorkerThread.cpp:86
0x400d5b5a: concurrency::OSThread::run() at /home/runner/work/firmware/firmware/src/concurrency/OSThread.cpp:45
0x400fc2e5: ThreadController::runOrDelay() at /home/runner/work/firmware/firmware/.pio/libdeps/tlora-v2-1-1.6/Thread/ThreadController.cpp:59
0x400deb8a: loop() at /home/runner/work/firmware/firmware/src/GPSStatus.h:142
0x4012e6f9: loopTask(void*) at /home/runner/.platformio/packages/framework-arduinoespressif32/cores/esp32/main.cpp:50
Seems also related to heap issues. I’m afraid you hit the limit of what these devices are capable of with such a large network.
The other crash seems related to the Wi-Fi connection (fail on fd 52, errno: 11, "No more processes"). A quick search shows this might also be related to memory issues.
Try turning of the JSON for MQTT, it is really unstable and likely contributing to your problems.
It also seems like you have some settings on your ap that may conflict with ESP32 wifi, 200, 201 and 8 are all AP related wifi errors.
I tried to get rid of json in mqtt but did not help much since I got two evidences of the same problem with wifi and ‘no more process’ as shown above. I guess that in front of the state of my mesh there could not be a definite solution so I decided to change the role of my GW from router_client to repeater and things seem to run nice and easy this way. I understand also that this problem is already being followed on GitHub so I am closing this ticket.
At last the good news came with firmware 2.1.3 which I installed two days ago and eventually I noticed these problems to disappear! I then reconfigured my node GW as router_client and had no more auto-reboot problems whatsoever.
2 Likes